Analysis walkthrough
Here are a few examples on how the data can be analyzed. These examples are not necessarily interesting in their results but they demonstrate various ways to analyze data from the output files. The netCDF files can also be loaded and analyzed without Python (for example in MATLAB), and the general logic of the analysis would be the same (See Output files)
Analyzing a 2D experiment
Let’s go from A to Z through the analysis of the demo 2D movie.
First, let’s locate this demo movie on the disk. For this, we need to start a Python interpreter, load the default 2D configuration (because we want the 2D demo movie), and ask for the path of the movie (this will automatically download the movie if needed):
>>> import delta
>>> delta.assets.download_demo_movie("2D")
PosixPath('/home/virgile/.cache/delta/demo_movies/dev/unzipped/2D_demo/pos{p}cha{c}fra{t}.png')
Of course, the path might be different on your computer. The template returned corresponds to a directory containing 74 images:
$ ls /home/virgile/.cache/delta/demo_movies/dev/unzipped/2D_demo/
pos1cha1fra000001.tif
pos1cha1fra000002.tif
pos1cha1fra000003.tif
pos1cha1fra000004.tif
...
pos1cha1fra000074.tif
We understand that the name template corresponds to position (first), channel
(second) and frame/timepoint (last): pos{p}cha{c}fra{t}.tif We will call
the command-line DeLTA utility with this template, along with -c 2D (it is
a 2D movie), and where we want the results files to be created with -o
2D_results (if this directory doesn’t exist, it will be created).
$ delta run -c 2D -o 2D_results -i /home/virgile/.cache/delta/demo_movies/dev/unzipped/2D_demo/pos{p}cha{c}fra{t}.png
DeLTA runs, and after a little while creates a results file
Position000001.nc and a movie Position000001.mp4 in the directory
2D_results. We will now extract the cell measurements to make plots.
Although we can manually open and work with the .nc file with xarray,
the easiest is to use the DeLTA library to recreate a Position
object:
import delta

position = delta.pipeline.Position.load_netcdf("2D_results/Position000001.nc")
Let’s extract the first and only ROI (i.e. the whole frame), and plot the lineage schematically:
>>> roi = position.rois[0]
>>> print(roi.lineage)
frames    : ...........................................................................
cell #0001:  ╺╼╼╼╼╼╼╼╼╼╼┮╼╼╼╼╼╼┮╼╼╼╼╼┮╼╼╼╼╼╼╼╼╼┮╼╼╼╼╼╼╼╼┮╼╼╼╼╼╼╼╼╼╼╼┮╼╼╼╼╼╼╼╼╼╼┮╼╼╼╼╼╼╼
cell #0125:             │      │     │         │        │           │          ┕╼╼╼╼╼╼╼
cell #0068:             │      │     │         │        │           ┕╼╼╼╼╼╼╼╼╼╼╼╼┮╼╼╼╼╼
cell #0140:             │      │     │         │        │                        ┕╼╼╼╼╼
cell #0040:             │      │     │         │        ┕╼╼╼╼╼╼╼╼╼╼╼┮╼╼╼╼╼╼╼╼╼╼┮╼╼╼╼╼╼╼
cell #0126:             │      │     │         │                    │          ┕╼╼╼╼╼╼╼
cell #0069:             │      │     │         │                    ┕╼╼╼╼╼╼╼╼╼╼╼╼╼┮╼╼╼╼
cell #0148:             │      │     │         │                                  ┕╼╼╼╼
[...]
cell #0044:                                              ┕╼╼╼╼╼╼╼╼╼╼╼╼┮╼╼╼╼╼╼╼╼╼╼╼╼╼╼╼╼
cell #0086:                                                           ┕╼╼╼╼╼╼╼╼╼╼╼┮╼╼╼╼
cell #0151:                                                                       ┕╼╼╼╼
cell #0002:  ╺╼╼╼╼╼╼╼╼╼╼╼┮╼╼╼╼╼╼╼┮╼╼╼╼╼┮╼╼╼╼╼╼┮╼╼╼╼╼╼╼╼┮╼╼╼╼╼╼╼╼╼╼╼╼╼┮╼╼╼╼╼╼╼╼╼╼╼╼╼┮╼╼╼
cell #0156:              │       │     │      │        │             │             ┕╼╼╼
cell #0078:              │       │     │      │        │             ┕╼╼╼╼╼╼╼╼┮╼╼╼╼╼╼╼╼
cell #0121:              │       │     │      │        │                      ┕╼╼╼╼╼╼╼╼
cell #0034:              │       │     │      │        ┕╼╼╼╼╼╼╼╼╼╼╼╼╼╼╼╼╼╼╼┮╼╼╼╼╼╼╼╼╼╼╼
cell #0102:              │       │     │      │                            ┕╼╼╼╼╼╼╼╼╼╼┮
cell #0178:              │       │     │      │                                       ┕
[...]
cell #0056:                                                    ┕╼╼╼╼╼╼╼╼╼╼╼┮╼╼╼╼╼╼╼╼╼╼╼
cell #0106:                                                                ┕╼╼╼╼╼╼╼╼╼╼╼
We see that cells 1 and 2, both initially present, each have a large lineage tree.
Let’s confirm that these cells are the only ones that were present on the initial frame:
import numpy as np

# Looping over the cells in the lineage, checking if their first frame
# corresponds to the first frame of the ROI
initial_cells = [
    cellid
    for cellid, cell in roi.lineage.cells.items()
    if cell.first_frame == roi.first_frame
]
assert initial_cells == [1, 2]
# Note: we could also have checked it by looking at the labels on the first
# image (0 is the background label)
assert np.array_equal(
    np.unique(roi.get_labels(roi.first_frame)),
    [0, 1, 2],
)
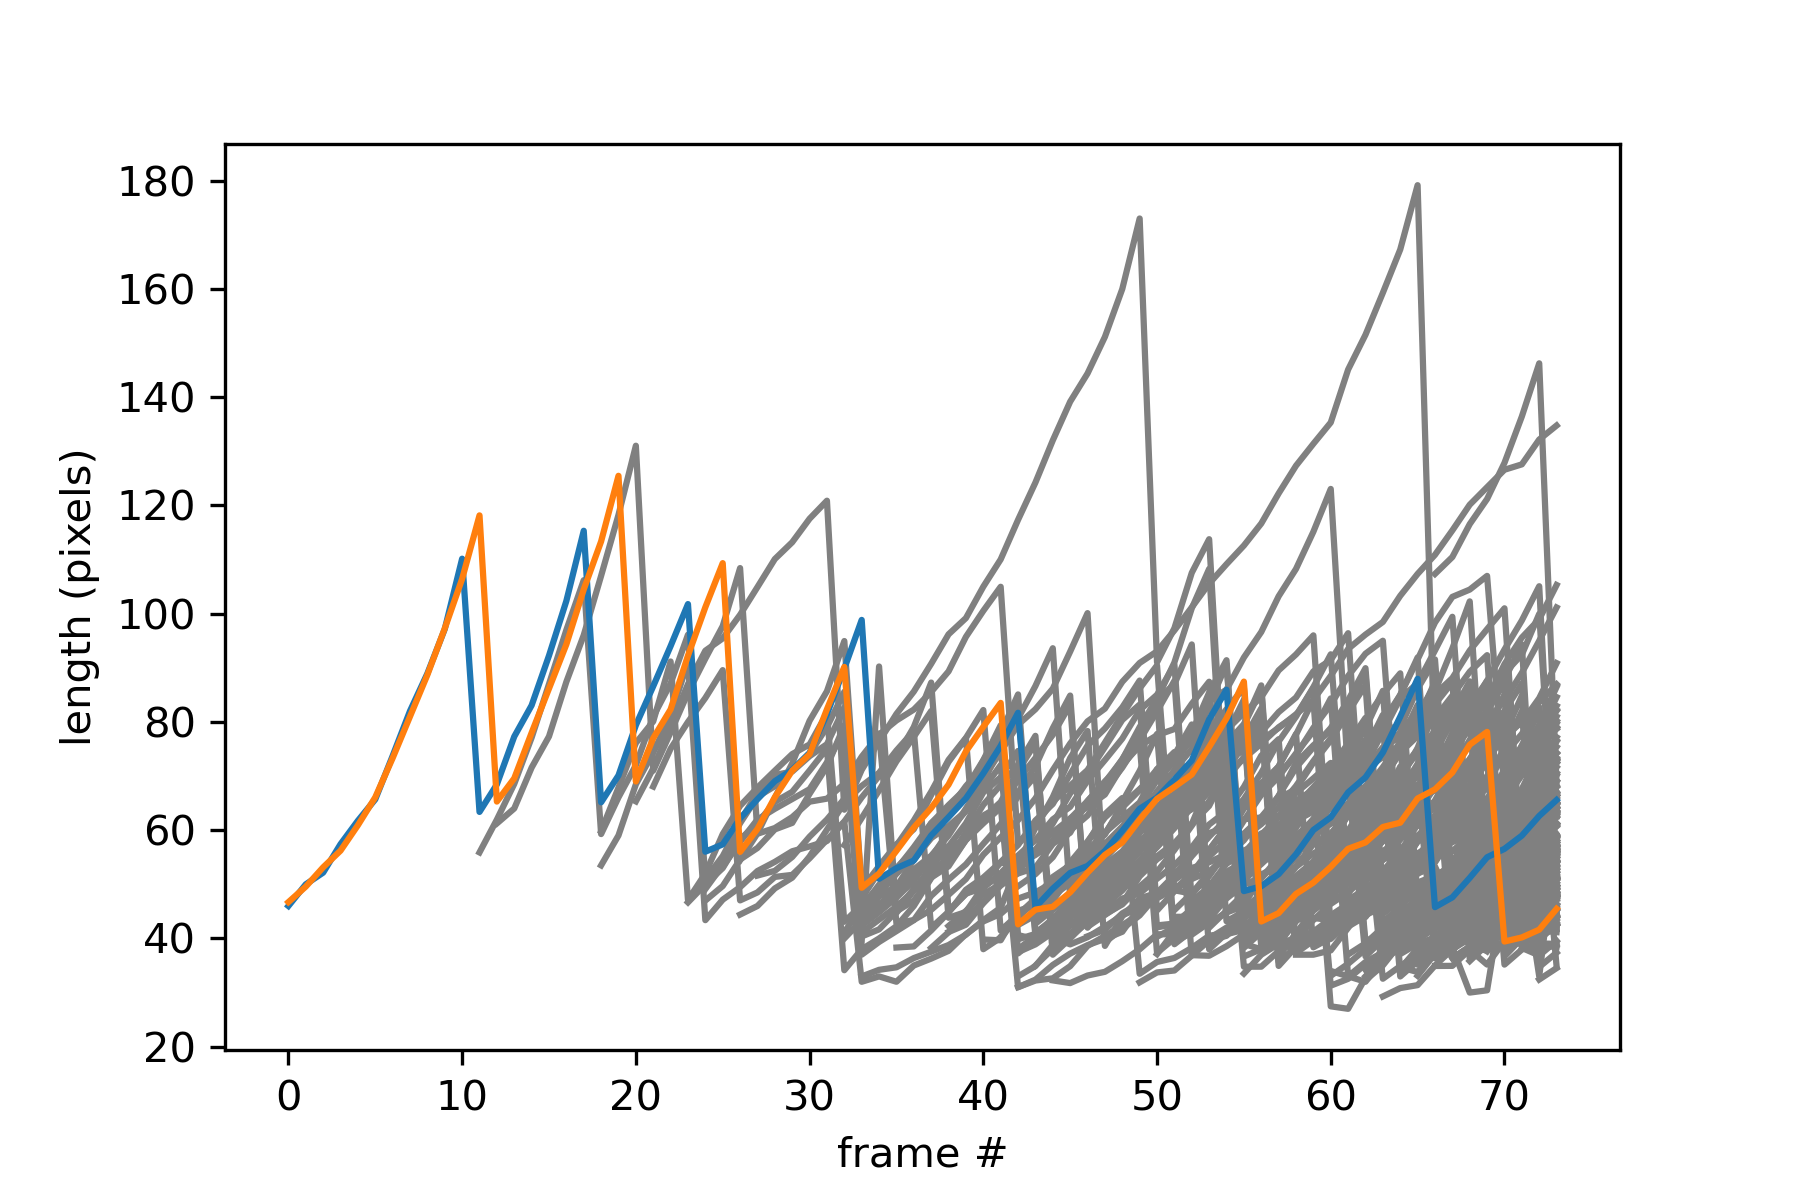
Plot each cell’s length over time, with different colors for the first cells:
import matplotlib.pyplot as plt

for cellid, cell in roi.lineage.cells.items():
    if cellid not in initial_cells:
        lengths = [cell.features(frame).length for frame in cell.frames]
        plt.plot(cell.frames, lengths, color="gray")

for cellid in initial_cells:
    cell = roi.lineage.cells[cellid]
    lengths = [cell.features(frame).length for frame in cell.frames]
    plt.plot(cell.frames, lengths)

plt.xlabel("frame #")
plt.ylabel("length (pixels)")
plt.show()
You should get this:
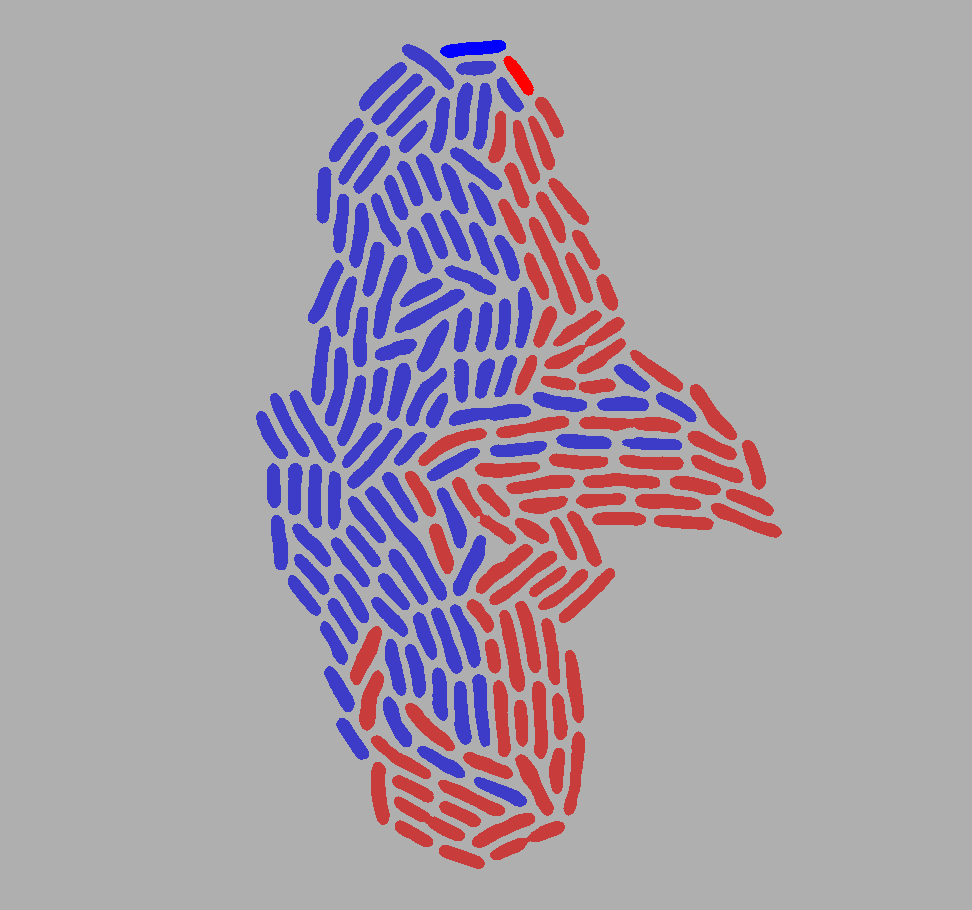
You can also display which cells are descended from either of the first two cells on the last frame.
First define a recursive function to retrieve which of the initial two cells is the original ancestor of a given cell:
def comes_from(lineage: delta.lineage.Lineage, cellid: int) -> int:

    # Get the cell with this cell ID
    cell = lineage.cells[cellid]

    # If this cell doesn't have a mother, then we return its number
    if cell.motherid is None:
        return cellid

    # Otherwise, we recurse with the mother
    return comes_from(lineage, cell.motherid)
Then go over every cell of the last frame to reconstruct the image based on each cells’ ancestry:
# Last labels frame
labels = roi.get_labels(74)

# Initialize color image (all light gray)
color_image = np.full(fill_value=175, shape=(*labels.shape, 3), dtype=np.uint8)

# Go over cells in last frame
for cellid in np.unique(labels)[1:]:

    # Which initial cell is the ancestor?
    ancestor = comes_from(roi.lineage, cellid)

    # Pick color based on ancestor
    if cellid == 1:
        color = [0, 0, 255]
    elif cellid == 2:
        color = [255, 0, 0]
    elif ancestor == 1:
        color = [60, 60, 200]
    elif ancestor == 2:
        color = [200, 60, 60]

    # Color the cell in the image
    color_image[labels == cellid] = color

plt.imshow(color_image)
plt.show()
Which should give you something like:
Analyzing a mother machine experiment
Let’s go through the same steps, first by locating the demo mothermachine movie:
>>> import delta
>>> delta.assets.download_demo_movie("mothermachine")
PosixPath('/home/virgile/.cache/delta/demo_movies/dev/unzipped/mothermachine_demo/Pos{p}Chan{c}Frames{t}.png')
Of course, the path might be different on your computer.
We will call the command-line DeLTA utility with this template, along with -c
mothermachine, and where we want the results files to be created with -o
moma_results (if this directory doesn’t exist, it will be created).
$ delta run -c mothermachine -o moma_results -i /home/virgile/.cache/delta/demo_movies/dev/unzipped/mothermachine_demo/Pos{p}Chan{c}Frames{t}.png
Once DeLTA finishes running, we can load one of the three positions back to Python:
import delta

position = delta.pipeline.Position.load_netcdf("moma_results/Position000001.nc")

# 3rd chamber (index 2)
roi = position.rois[2]
This is a relatively low-resolution movie and there are a few segmentation and tracking errors made by DeLTA, especially on this 3rd chamber, as illustrated by the lineage plot:
import matplotlib.pyplot as plt

# define colors explicitly to match the colors of the movie
colors = delta.utils.random_colors(sorted(roi.lineage.cells.keys()), seed=roi.roi_nb)

# plot the lineage
fig, ax = plt.subplots()
roi.lineage.plot(ax=ax, colors=colors, labels=True)
plt.show()

The biggest problem is that the mother cell is lost during the course of the experiment. Why did this happen?

Looking at the movie, we can see that the mother cell, which is alone on frame 21, is splitting at frame 22 not into 2, but into 3 cells (14 (top), 1 (middle) and 13 (bottom)). DeLTA chose the center cell as the successor of the mother cell, but for a simpler analysis we would prefer it to be the top cell. Fortunately, we can fix that easily.
First, we have to unlink the daughter-mother relationship between 1 and 13, in order to attach 14 to 1:
# Make cell #13 an orphan
roi.adopt(13, None)
# Make cell #1 the mother of cell #14
roi.adopt(14, 1)
Then, we have to swap the roles of cells 1 and 14, to ensure continuity of the mother cell:
# Exchange mother and daughter relationship between cell #14 and its mother
roi.pivot(14)
Now we can plot again the lineage to check if it worked:
fig, ax = plt.subplots()
roi.lineage.plot(ax=ax, colors=colors, labels=True)
plt.show()

A similar issue, between frames 149 and 150, is causing the separation of cell number 55.
Then we can plot the fluorescence for the mother cell and its daughters:
import matplotlib.pyplot as plt

# Extract mother cell
mother = roi.lineage.cells[1]

# Plot daughters' fluorescence
for frame in mother.frames:
    daughterid = mother.daughterid(frame)
    if daughterid is None:
        continue
    daughter = roi.lineage.cells[daughterid]
    # Extracting the fluorescence values for the daughter (first fluo channel)
    fluo = [daughter.features(fr).fluo[0] for fr in daughter.frames]
    plt.plot(daughter.frames, fluo, color="gray")

# Plot mother fluorescence
fluo = [mother.features(fr).fluo[0] for fr in mother.frames]
plt.plot(mother.frames, fluo)

plt.xlabel("frame #")
plt.ylabel("GFP (a.u.)")
plt.show()
Which should give you:

And we can also reconstruct the whole field of view and color cells based on their generation:
import numpy as np


def generation(lineage: delta.lineage.Lineage, cellid: int) -> int:
    "Returns the degree of kinship from a cell to the initial cell."
    cell = lineage.cells[cellid]
    if cell.motherid is None:
        return 0
    return 1 + generation(lineage, cell.motherid)


# Some random frame
frame = 42

# Create as many plots as ROIs
fig, axs = plt.subplots(1, len(position.rois))

# Remove ticks
plt.setp(axs, xticks=[], yticks=[])

colormap = plt.get_cmap("plasma", lut=5)

for roi in position.rois:
    labels = roi.get_labels(frame)
    color_image = np.full(shape=(*labels.shape, 3), fill_value=255, dtype=np.uint8)
    # Which cells are present on this frame?
    cellids = delta.utils.cells_in_frame(labels)
    for cellid in cellids:
        cell_gen = generation(roi.lineage, cellid)
        color = np.array(colormap(cell_gen)[:3])
        color_image[labels == cellid] = 255 * color
    axs[roi.roi_nb].imshow(color_image)
    axs[roi.roi_nb].set_title(roi.roi_nb)

plt.show()
Which should produce an image like this:

For other DeLTA-related activities, you might find this book useful.